Israeli developer Nir Sofer is the person behind the outstanding Windows utility site nirsoft.net. I’ll be describing his blue screen viewing tool in today’s item. And when I explain what makes NirSoft BlueScreenView worth learning, I mean it is something handy to have around for both Windows professionals and enthusiasts.
Why say this? Because, sooner or later, nearly every Windows PC experiences a crash. In older Windows versions, such a screen was invariably blue. That earned it the initialism BSOD, for “Blue Screen of Death.” In Windows 10, such screens sometimes come up in green instead and may be called GSODs for that reason. For a fascinating historical look at BSODs from the past, check out Mark Russinovich’s evil little BlueScreen Screen Saver. It not only simulates BSODs, it also simulates the data acquisition and reboot phases that follow immediately thereafter. Says Russinovich “…its accuracy will fool even advanced NT developers” (it does not, however, look like a real Windows 10 BSOD or GSOD). Like I said: it’s evil.
Why Is NirSoft BlueScreenView Worth Learning?
Simply put, this nice little tool reads the dump files that Windows collects as it recovers from a serious error. It provides immediate insight into what blew up, and what other OS and application modules were involved.
You can provoke BSOD with an input string to an administrative command prompt, if you like. WARNING! This will immediately crash the PC into which it is entered. Close all apps, and save your work beforehand, to avoid unpleasant surprises.
That command string is:
taskkill /im svchost.exe /f
Svchost.exe is a critical Windows 10 process. It acts as a shell for loading services based around dynamic load library (DLL) files. Because DLLs are often shared, multiple processes will call on a single svchost.exe instance to access its DLL. By running this command you’re killing all svchost instances immediately. This renders Windows unable to run, so it crashes instead.
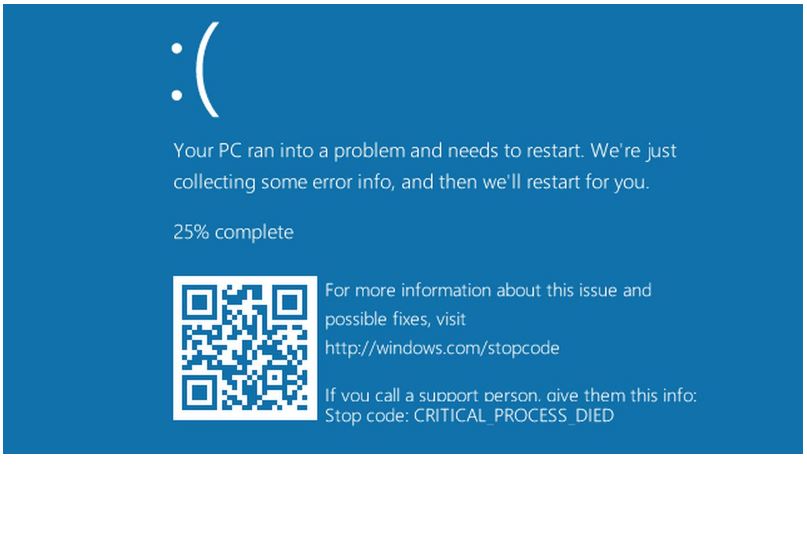
The flag in the resulting BSOD reads “CRITICAL_PROCESS_DIED.” That brief phrase tells you that, except as a sure-fire way of provoking a BSOD, this is an extremely bad idea. But it’s a useful technique to cause a bluescreen, to show what NirSoft BlueScreenView can do.
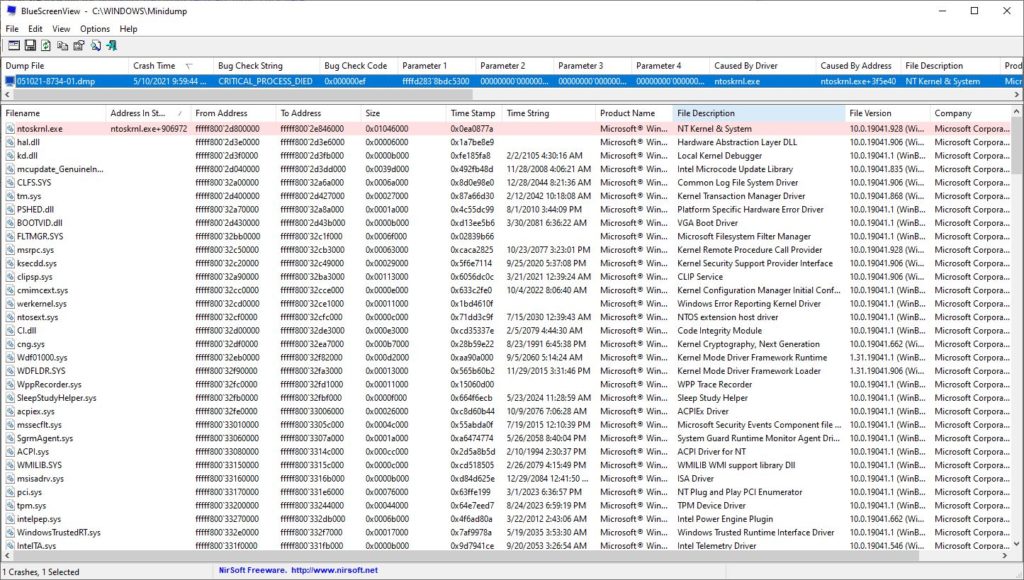
Dump files in top pane, Dump trace in lower pane. This one shows the CRITICAL_PROCESS_DIED error from the lead-in graphic.
[Click image for full-sized view.]
Working Through BlueScreenView Output
As you examine the image above, you’ll see a dump file that starts with a date string (051021) and ends with the tell-tale file extension “.dmp”. It shows a time stamp, the bug check string, and a bug check code, followed by up to 4 parameters. It also shows which driver caused the crash: in this case, we killed the driver for the operating sytem kernel itself! (That’s noskrnl.exe plus a hex offset, as shown in column 9.)
Generally when I’m using this tool, I look first at Column 9 (caused by driver). That’s because the transitory blue screen window provides most of the preceding data. I usually care most about the bug check string and code because they make dandy lookup strings for guidance online. Column 9 points to the actual cause, and can be extremely informative.
Spend a little time with this tool, and use it to practice reading dump files. Trust me: it’ll come in handy someday. ‘Nuff said

